Technology
SonarQube is a code quality and security analysis platform that helps organizations continuously inspect and improve the quality of their software applications.
SonarQube performs automated static code analysis to detect bugs, vulnerabilities, and code smells in source code. It supports multiple programming languages such as Java, Python, JavaScript, C#, and many others. The platform integrates with modern development tools and CI/CD pipelines, allowing teams to analyze code during the development lifecycle.
With SonarQube, developers can monitor code quality using dashboards, reports, and quality gates that enforce coding standards before code is deployed into production environments. This helps organizations detect problems early, reduce technical debt, and maintain secure and reliable applications.
In simple terms, SonarQube acts as an automated code quality inspection system that enables organizations to maintain high coding standards, improve security, and build scalable software systems.
Company Overview and Challenges
A rapidly growing software development company delivering enterprise applications to global clients approached our team to improve the quality and security of their software products.
The organization had more than 200 developers working on multiple projects across development, testing, and production environments. Their goal was to deliver reliable and secure applications while maintaining high development speed.However, as the development teams grew, maintaining consistent code quality became increasingly difficult.
Many developers followed different coding standards, which resulted in inconsistent code structures across projects. Bugs were often detected late in the development cycle, sometimes even after deployment into production environments.The absence of an automated code analysis system also made it difficult to identify security vulnerabilities in the codebase. As a result, technicaldebt continued to grow, and developers spent more time fixing issues rather than developing new features.
Manual code reviews alone were not sufficient to maintain the required level of quality across large codebases. The company realized that a centralized and automated code quality platform was necessary to ensure consistent coding standards and secure software development.
Implementation Strategy
To solve these challenges, the company implemented SonarQube as part of their development and DevOps workflow.
SonarQube was deployed as a centralized platform for continuous code quality inspection. Developers integrated SonarQube scanners into their build pipelines so that every code commit would automatically undergo code quality analysis.
Quality gates were configured to enforce coding standards, ensuring that code with critical bugs or vulnerabilities could not be merged into the main codebase.
By integrating SonarQube with the CI/CD pipeline, the organization ensured that code quality checks became a mandatory part of the development process.
Architecture
SonarQube Architecture in Company Environment
The company implemented SonarQube to automate and standardize code quality monitoring across all development teams. Instead of relying solely on manual code reviews, automated code analysis was introduced using SonarQube scanners.
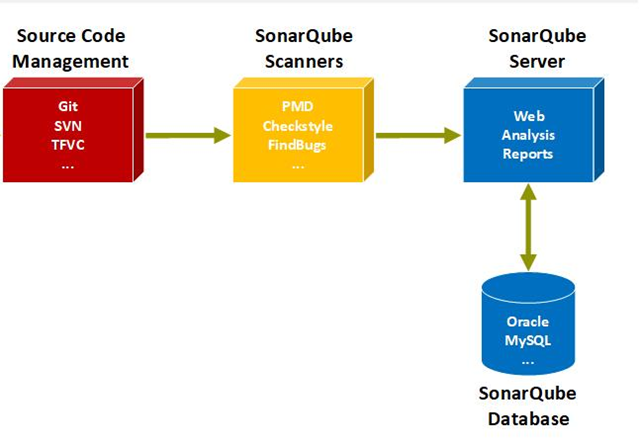
Developers committed their source code to version control systems. During the build process, SonarQube scanners analyzed the source code and sent analysis results to the SonarQube server. The server processed these results and stored them in a database.
The SonarQube dashboard provided detailed reports on code quality, security vulnerabilities, code duplication, and technical debt. This allowed developers and project managers to monitor the health of their applications in real time.
This architecture ensured continuous monitoring of code quality and helped teams maintain consistent coding practices across projects.
Architecture Components
• SonarQube Server managing code analysis results and dashboards
• SonarQube Scanner analyzing source code
• Database storing analysis results and historical metrics
• CI/CD Integration triggering automated code analysis
• Developer Dashboard providing issue tracking and reports
Architecture Flow

1. Developers commit source code to the repository
2. CI/CD pipeline triggers the build process
3. SonarQube scanner performs static code analysis
4. Analysis results are sent to the SonarQube server
5. Issues and quality metrics are stored in the database
6. Developers review and resolve issues through the dashboard
How SonarQube Helped
1. Standardized Code Quality
- All development teams followed consistent coding standards.
- Automated quality gates ensured that poor-quality code could not enter production.
- Code reviews became faster and more effective.
2. Faster Issue Detection
- Bugs and vulnerabilities were detected early during development.
- Developers could fix issues before code reached production.
- Debugging time was significantly reduced.
3. Improved Security
- Security vulnerabilities were automatically detected.
- Developers received alerts for potential security risks.
- Secure coding practices were enforced across projects.
4. Technical Debt Management
- Code smells and duplicated code were identified.
- Developers were able to continuously improve code maintainability.
- Technical debt was significantly reduced.
5. Integration with DevOps
- SonarQube integrated with CI/CD pipelines.
- Automated code quality checks became part of every build process.
- Development teams delivered updates more confidently.
6. Improved Developer Productivity
- Developers spent less time fixing production issues.
- Better code visibility improved collaboration between teams.
- Overall software quality improved significantly.
Business Impact
• 40% reduction in production bugs
• Improved software security and vulnerability detection
• Reduced technical debt
• Faster development and release cycles
• Increased developer productivity
Solutions Used
1. SonarQube Server
The SonarQube Server is the central component of the SonarQube platform that manages code analysis results, stores project information, and provides a web interface for developers to view reports. It processes the data sent by scanners, applies quality rules, and displays detailed insights about bugs, vulnerabilities, and code quality metrics.
2. SonarQube Scanners
SonarQube Scanners are tools used to analyze the source code during the build process. These scanners examine the codebase to detect issues such as bugs, security vulnerabilities, and code smells. After analysis, the scanners send the results to the SonarQube Server for further processing and reporting.
3. Static Code Analysis
Static Code Analysis is the process of analyzing source code without executing the program. SonarQube performs automated static analysis to identify coding errors, security risks, performance issues, and violations of coding standards early in the development process.
4. Quality Gates
Quality Gates are predefined conditions that determine whether the code meets the required quality standards. They automatically check metrics such as code coverage, bug count, and security vulnerabilities. If the code fails to meet the required conditions, the build or deployment process can be stopped until the issues are resolved.
5. CI/CD Integration
SonarQube integrates with Continuous Integration and Continuous Deployment (CI/CD) pipelines to automatically analyze code whenever new code is committed. Tools like Jenkins, GitHub Actions, or GitLab CI trigger the analysis process, ensuring that code quality checks are performed continuously during the development lifecycle.
6. Code Quality Dashboards
The SonarQube Dashboard provides a visual interface where developers and project managers can monitor code quality metrics. It displays information such as bugs, vulnerabilities, duplicated code, code coverage, and technical debt, allowing teams to quickly identify and fix issues.
7. Technical Debt Monitoring
Technical Debt Monitoring helps organizations track the amount of effort required to fix code quality issues. SonarQube estimates the time needed to resolve problems such as poor coding practices, duplicated code, or complex logic, helping teams prioritize improvements and maintain long-term software maintainability.
Conclusion
By implementing SonarQube, the company transformed its development process from manual code reviews to a fully automated code quality management system.
SonarQube enabled continuous monitoring of software quality, improved security practices, and helped developers maintain consistent coding standards across projects. As a result, the organization was able to deliver secure, reliable, and maintainable software applications.